PDF Report – Structure
In the following posts we are going to introduce our PDF report. We start with a short overview:
Structure of the report
PDF report contains three parts for now
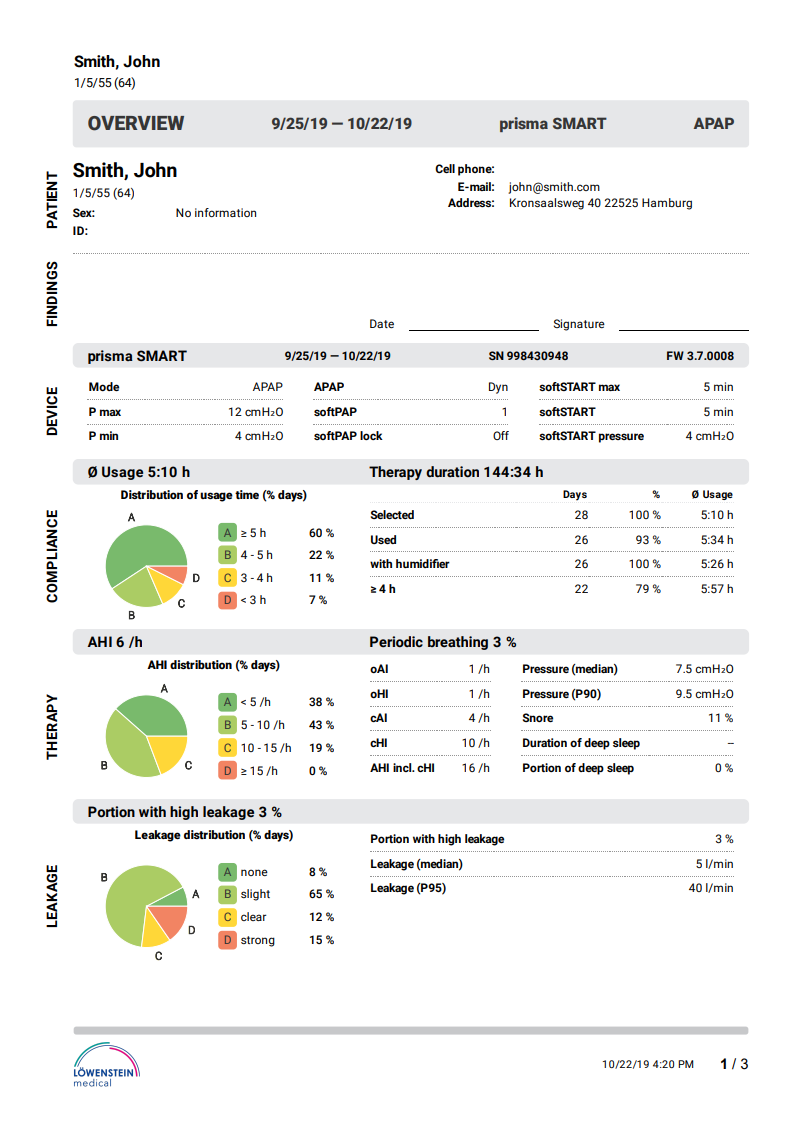
1. Overview page, which provides a summary about patients therapy situation over the entire time range selected for analysis
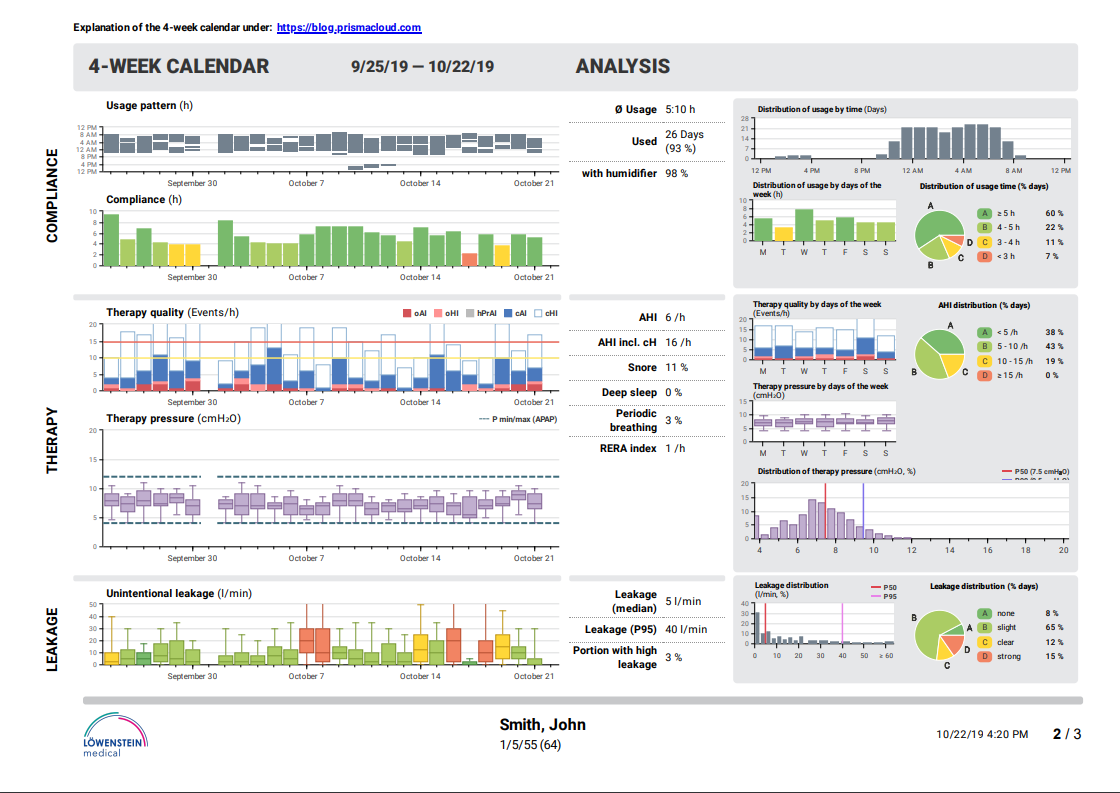
2. 4-week calendar, which provides a close-up analysis of last up to 28 days of selected time range for analysis. It supports you in identifying demand and type of intervention
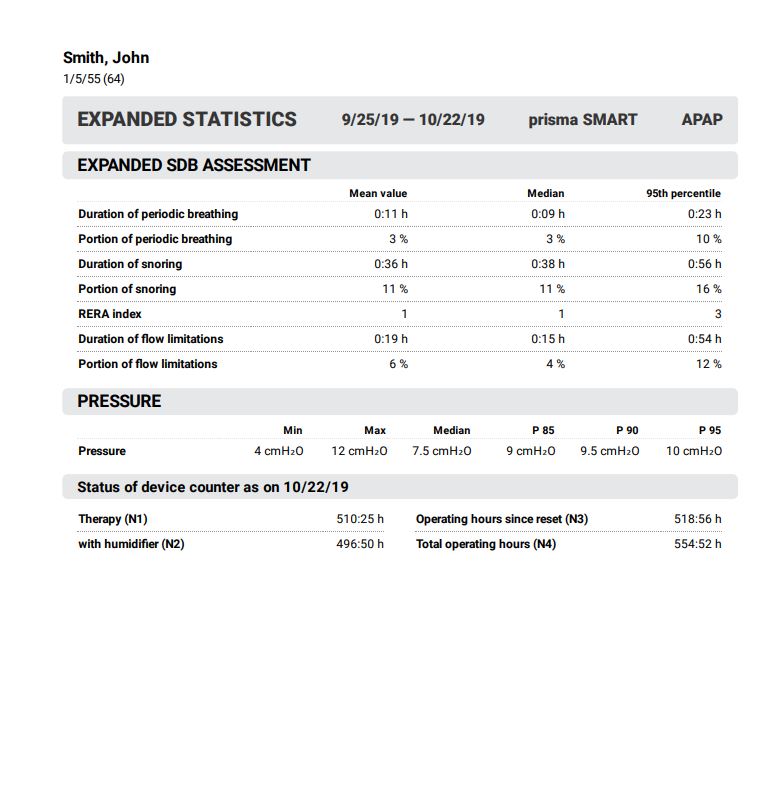
3. Expanded statistics, which provides more details about patients therapy situation over the entire time range selected for analysis.
Overview page
Beside administrative data of your patient, you will find the respective last therapy settings for the selected period, the overview of the device usage, major indices about the therapy success like o/c AHI, snoring, periodical breathing etc. as well as the information about the mask-fit.

4-week calendar
The 4-week calendar provides a close-up analysis of last up to 28 days of selected period for analysis. It supports you in identifying demand and type of intervention.
On the left part of the page, there is a therapy calendar with day-by-day data on device usage, therapy quality and leakage for the last 28 days. For the visualisation of some values like therapy pressure, leakage, breathing frequency or target volume, we use box plot diagrams.
From the right part of the 4-week calendar, so called Analysis part, you can get deeper insights about patient’s therapy.
The 4-week calendar is divided horizontally into 3 sections: Compliance, Therapy and Leakage

Expanded statistics

