6 posts tagged

report

Recent updates of prisma CLOUD (version 2.25.0)

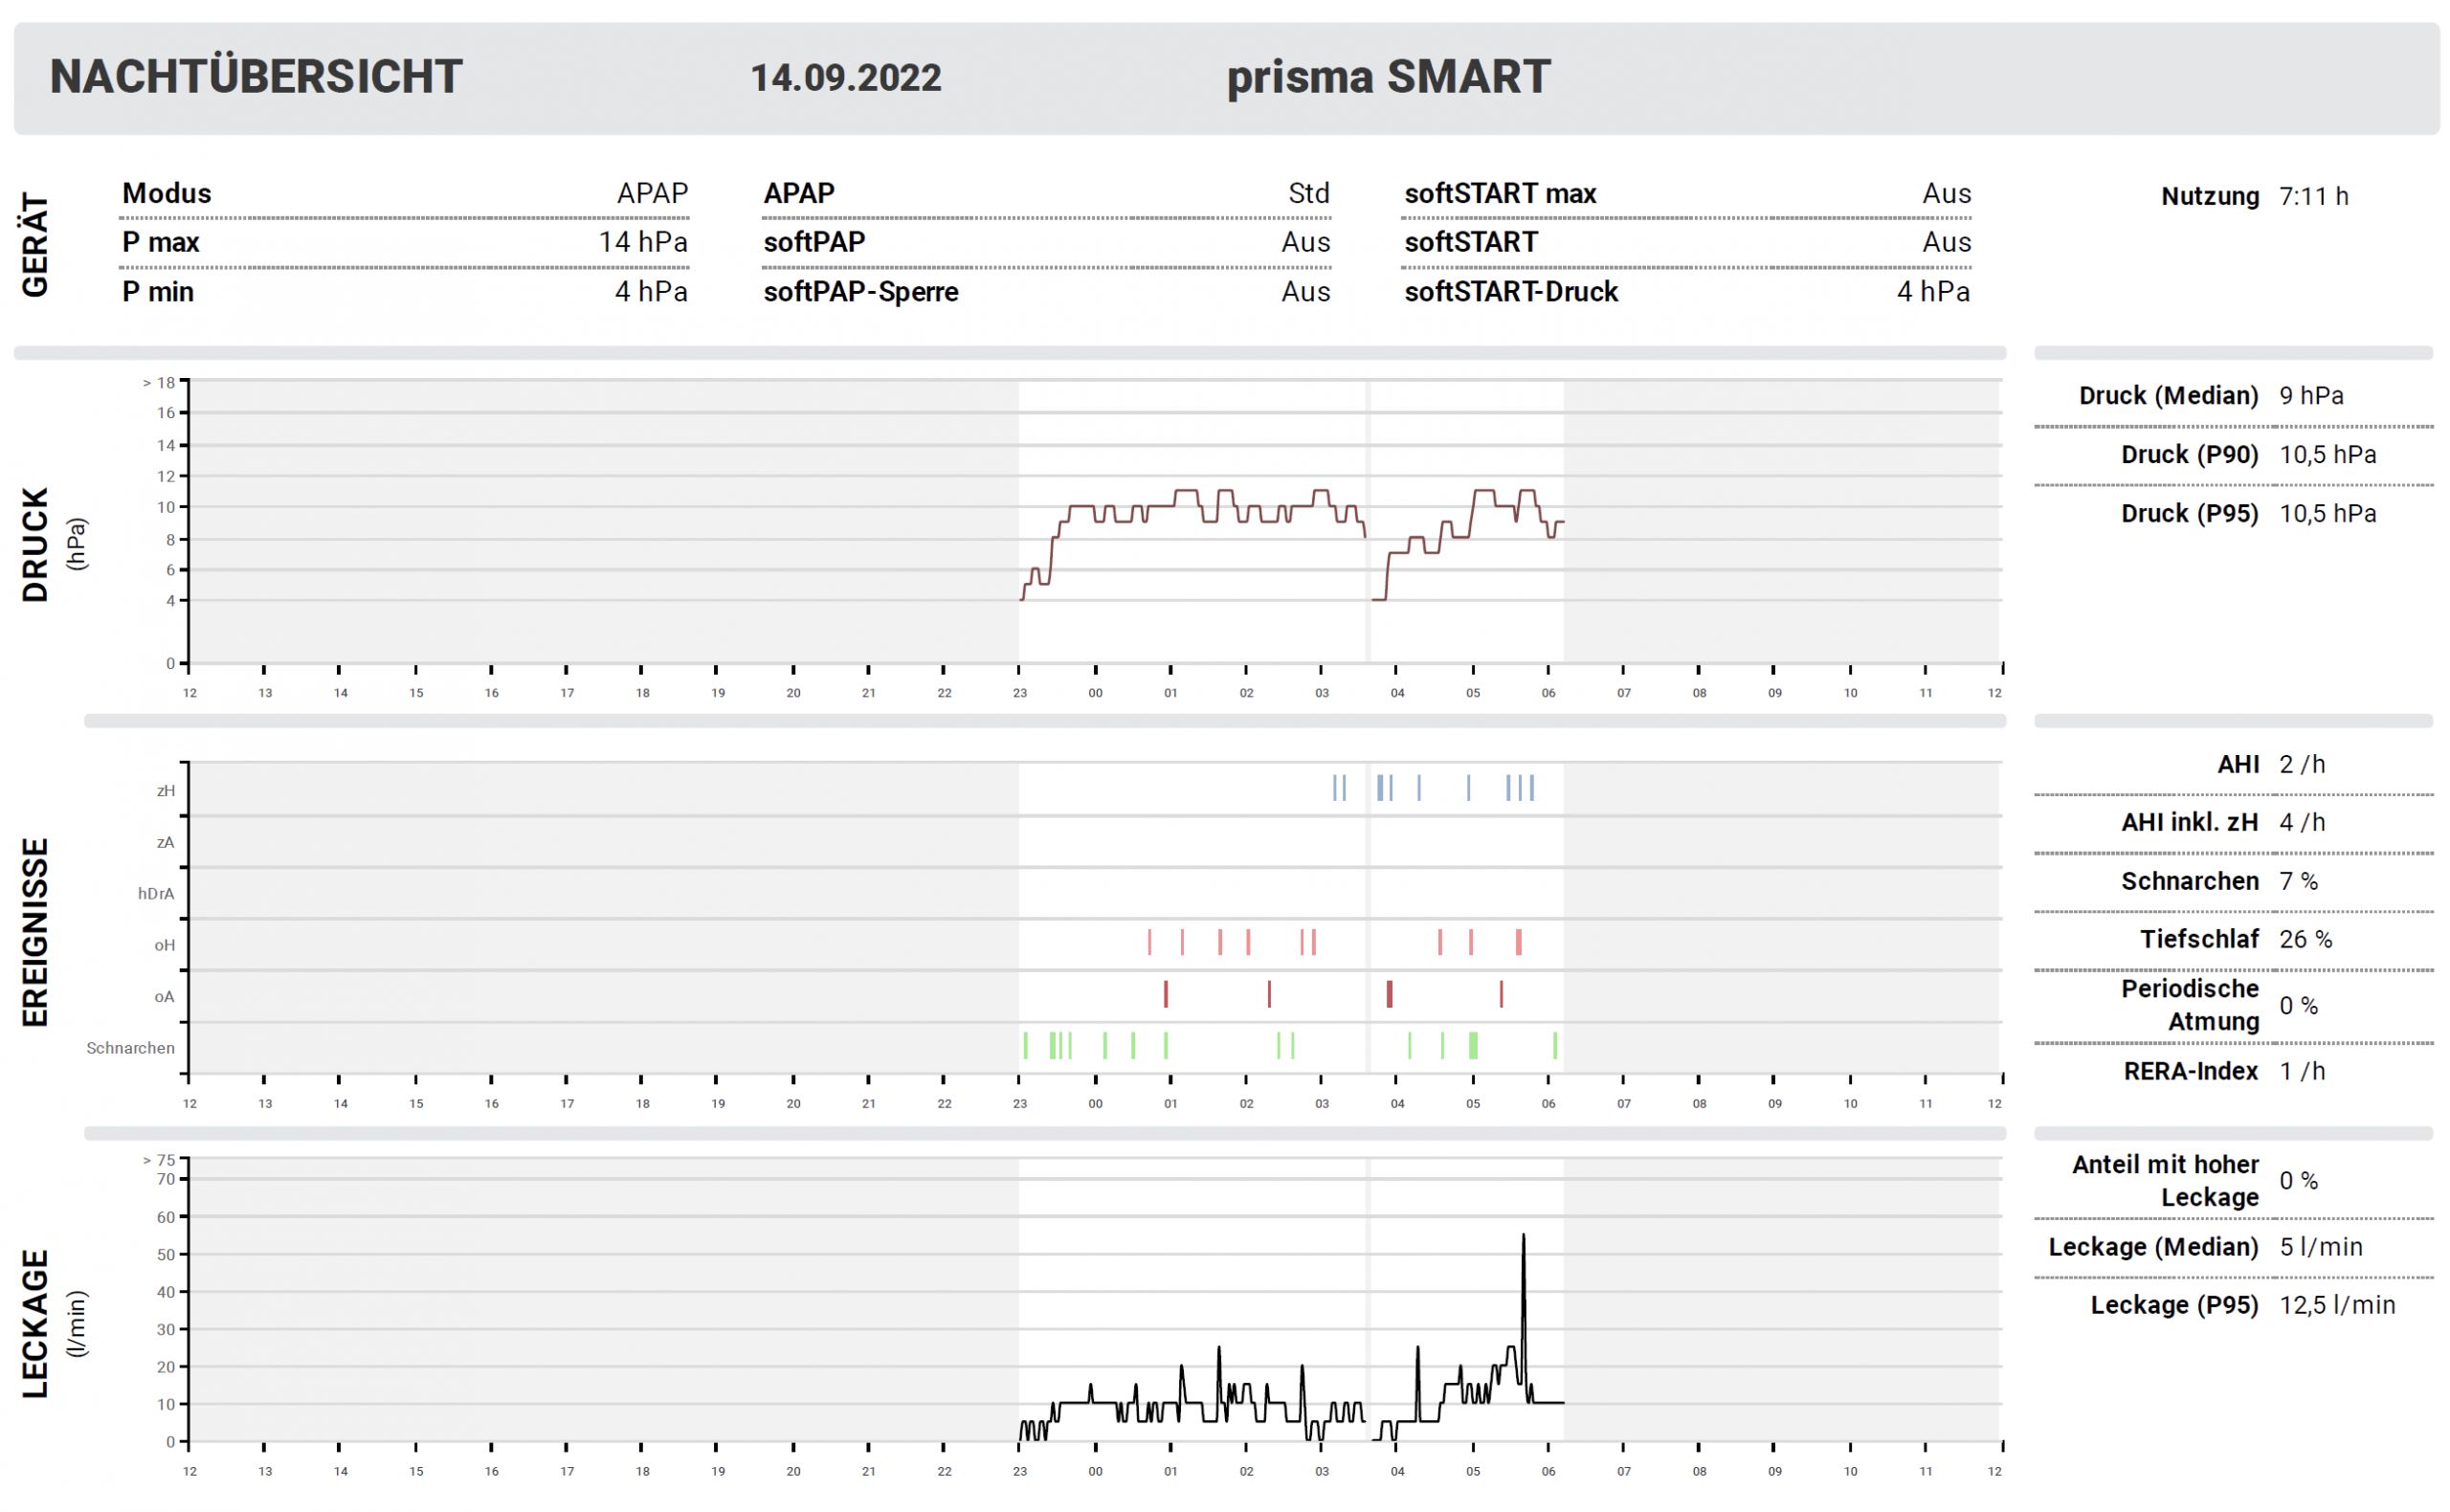
[New] Night overview section in PDF report

PDF report for prisma SOFT/SMART and prisma VENT therapy devices is now extended with a new Night Overview section to help getting more insights into a patient’s therapy.

Night Overview section provides visualization of trends for pressure, leakage and therapy events, based on low-resolution curves data (one record every 2 minutes) received from therapy devices.

For more details, please refer to this article.

[New] Scheduled reminders

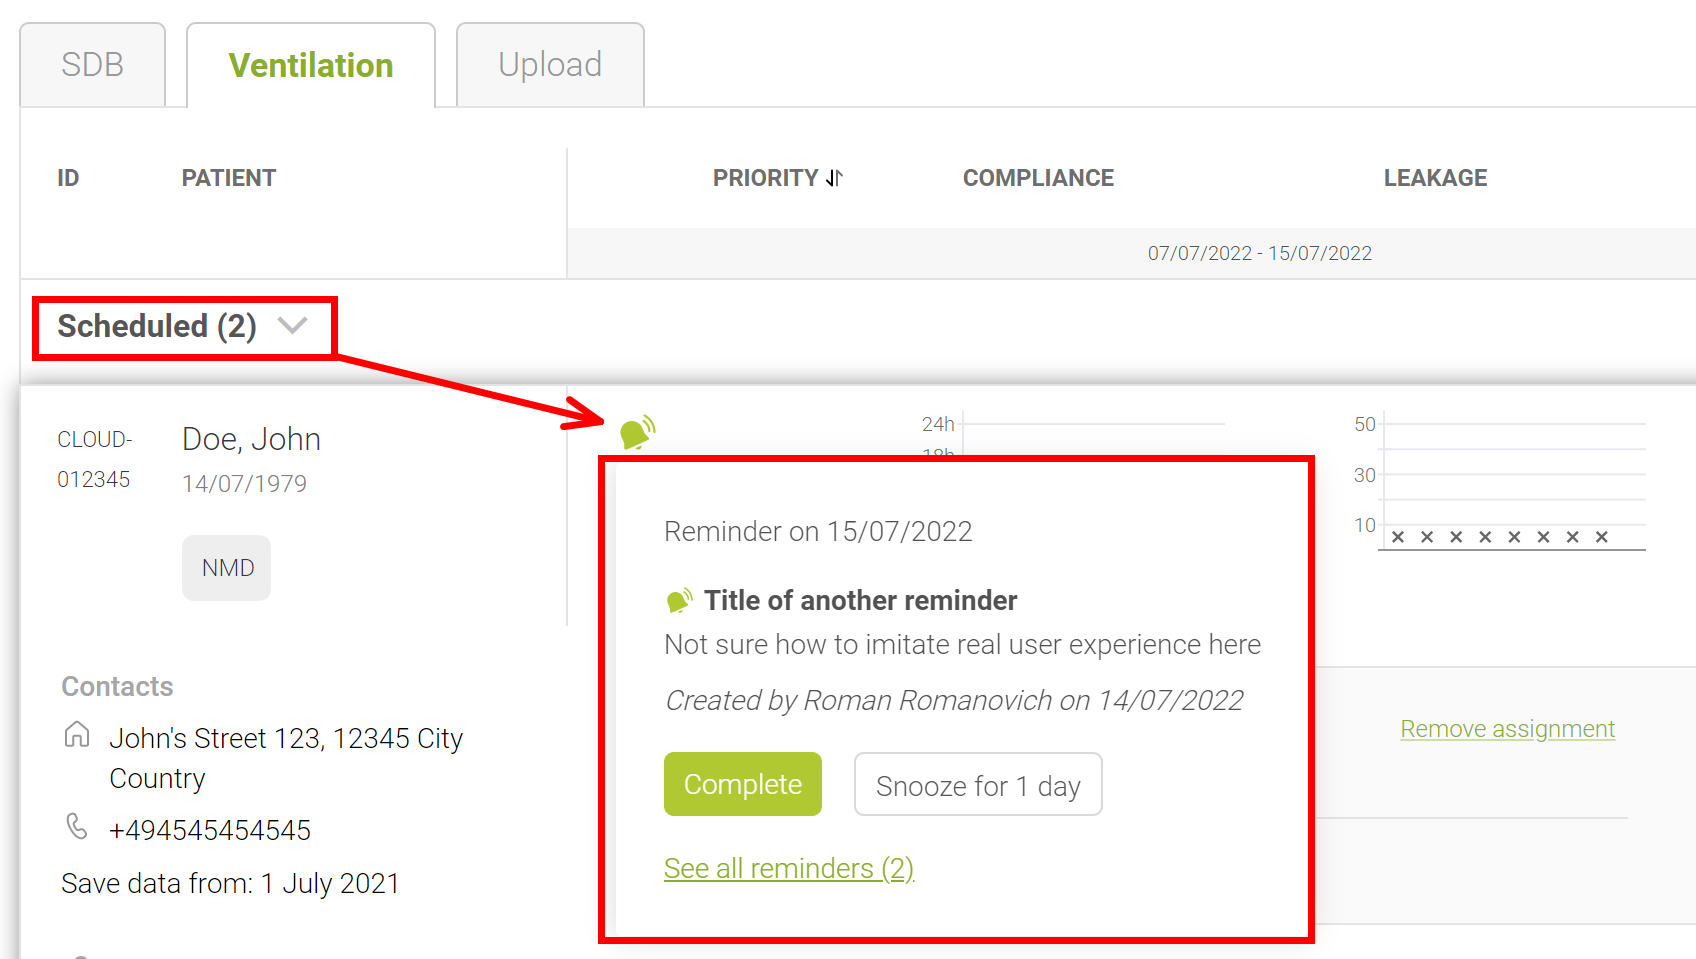
It is now possible to organize and keep track of different tasks by setting Scheduled Reminders from patients’ files.
To set up a new reminder concerning a particular patient open a patient file, go to ‘Reminders’ tab at the top of the page, and click ‘New reminder’ button.

When a due date is reached, corresponding patient is displayed on the top of patients lists (based on patient’s category) in ‘Scheduled’ section until a reminder is Snoozed or Completed.
[New] Export data from Patients tabs into CSV-file

Users with an access to Patients list can now create an export of all patients’ data into CSV-file for flexible usage and analysis. CSV-file export contains a flat list with same patients’ data that is visible in prisma CLOUD web UI.

General improvements of prisma CLOUD

  • More clarity on therapy data availability with comprehensive messages in patients’ accordions.
  • Disabling of data uploads with .pdat and .psstat file formats.
  • Regular deletion of therapy data associated with patients – therapy days dated more than 3 years ago is deleted on a regular basis.
  • Numerous bug fixes and improvements, providing more reliability, performance and stability.
 1145   2022   night overview   pdf   releasenotes   report   update

PDF Report – Night overview

Night Overview section provides visualization of trends for pressure, leakage and therapy events, based on low-resolution curves data received from therapy devices. In case this data is available within last 28 days of selected report period, each therapy day is printed on its own page (maximum 7 therapy days).

Low-resolution curves data (also called “trend curves”) is recorded 1 sample per 2 minutes in accordance with the following specification.

Signal Name Downsampling Specification prisma SOFT/SMART prisma VENT
Program Usage Program with highest portion of usage in storage epoch x
Therapy pressure (CPAP / APAP / EPAP / zero if therapy mode is HFT) Maximum value of storage epoch x x
Leakage Maximum value of storage epoch x x
Respiratory rate Median value of storage epoch x
Tidal Volume Median value of storage epoch x
Minute Volume Maximum value of storage epoch x
Ti/T Median value of storage epoch x
SpO2 Minimum value of storage epoch x
Pulse Rate Maximum value of storage epoch x
Spontaneous Inspirations/Expirations Portion of spontaneous inspirations in storage epoch x
oA at least one event during storage epoch x x
cA at least one event during storage epoch x
hPrA at least one event during storage epoch x x
oH at least one event during storage epoch x x
cH at least one event during storage epoch x x
RERA at least one event during storage epoch x
Snoring at least one event during storage epoch x

Important to know

  • prisma SOFT/SMART therapy devices transmit trend curves data only in case both conditions are met: (1) an SD-card is inserted into a device during therapy and transmission, and (2) device sends data upon automatic daily transmissions.
  • prisma VENT therapy devices transmit trend curves data only starting from 3.9.5 firmware version.
 1113   2022   night overview   pdf   report

Update to version 2.13.0

prisma CLOUD goes VENTILATION

The use of prisma CLOUD together with prisma VENT has been possible for some time. With the latest update, we are adding new functions to prisma CLOUD and implementing numerous improvements that make working with prisma VENT even easier and much better. Benefit from sophisticated functions and visualizations that simplify your daily work and allow you to better accompany your patients’ therapy. You don’t need to do anything to benefit from all this, all updates are rolled out automatically. We take care of all the necessary steps for you. Here is an overview of the current update:


PDF report

  1. prisma VENT support in 4-week calendar
    • Clear graphical representation for periods of four weeks for
      • Usage pattern (compliance) / apnea indices / therapy pressures / tidal volumes / respiratory rates / leakages
    • Visualization and summary and a clear frequency distribution of these values ​​for a quick diagnosis
  1. Oxygen saturation for prisma VENT (SpO2)
    • Precise information for the day when prisma CHECK (SpO2 module) is connected
      • SpO2 / pulse rate / usage time
    • Visualization and summary plus a clear distribution of these values ​​for a quick overview
  1. Optimized display of usage times (compliance) in the therapy overview for prisma VENT


Tele Settings

  1. The name of the user who changed the therapy settings is saved and displayed


Device registration with PIC (personal identification code)

  1. Every logged in user can create a PIC
  2. Create PIC + card
    • Create an SD card with PIC and the current firmware files with just a few clicks
    • Update the firmware and register your devices with it in one step with prisma CLOUD


General stability and performance improvements

 1060   2020   4-week calendar   pdf   releasenotes   report   update

Update auf Version 2.13.0

prisma CLOUD goes VENTILATION

Die Nutzung von prisma CLOUD zusammen mit prisma VENT ist schon seit einiger Zeit möglich. Mit dem aktuellen Update fügen wir neue Funktionen zu prisma CLOUD hinzu und setzen zahlreiche Verbesserungen um, die die Arbeit mit prisma VENT noch einfacher und besser machen. Profitieren Sie von professionellen Funktionen und Auswertungen, die Ihre tägliche Arbeit vereinfachen und Sie die Therapie Ihrer Patienten noch besser begleiten lassen. Sie brauchen nichts zu tun, um davon zu profitieren, das Update wird automatisch zur Verfügung gestellt. Alle notwendigen Schritte erledigen wir für Sie. Hier finden Sie eine Übersicht über das aktuelle Update:


PDF-Report

  1. prisma VENT Unterstützung im 4-Wochen-Kalender
    • Übersichtliche grafische Darstellung für Zeiträume von vier Wochen
      • Nutzungsschemata (Compliance) / Apnoe-Indizes / Therapiedrücke / Tidalvolumina / Atmungsfrequenzen / Leckagen
  • Auswertung und Zusammenfassung sowie eine übersichtliche Häufigkeitsverteilung dieser Werte für eine schnelle Diagnose
  1. Sauerstoffsättigung für prisma VENT (SpO2)
    • Tagesgenaue Informationen bei angeschlossenem prisma CHECK (SpO2-Modul)
      • SpO2 / Pulsrate / Nutzungszeit
    • Auswertung und Zusammenfassung sowie eine Häufigkeitsverteilung dieser Werte für eine schnelle Übersicht
  1. Optimierte Darstellung der Nutzungszeiten (Compliance) in der Therapieübersicht für prisma VENT


Telesettings

  1. Name des Nutzers, der Therapieeinstellungen verändert hat, wird gespeichert und angezeigt


Geräteanmeldung mit PIC (Persönlicher Identifikationscode)

  1. Jeder eingeloggte Nutzer kann einen PIC erzeugen
  2. PIC+ Karte erstellen
    • Erstellen Sie mit wenigen Klicks eine SD Karte mit PIC und den aktuellen Firmware-Dateien
    • Aktualisieren Sie die Firmware und registrieren Sie Ihre Geräte damit in einem Schritt mir prisma CLOUD


Allgemeine Stabilitäts- und Leistungsverbesserungen

 995   2020   4-week calendar   pdf   releasenotes   report   update

PDF Report – Box Plots

A box plot should quickly give you an idea of where the data is and how it spreads across the possible range. A box depicts the range containing 50% of the data. The median is shown as a horizontal line within the box.The median is the typical value and is unaffected by the outliers, it divides the data in two ranges; each range contains 50% of the data. Our box plots have also lines (so called whiskers), which extend the boxes vertically, indicating variability outside the lower (25th percentile) and upper (75th percentile) quartiles.
The spacing between the different parts of the box indicate the degree of scattering and skewness in the data.

 802   2019   4-week calendar   box plot   pdf   report

PDF Report – Structure

In the following posts we are going to introduce our PDF report. We start with a short overview:
Structure of the report
PDF report contains three parts for now
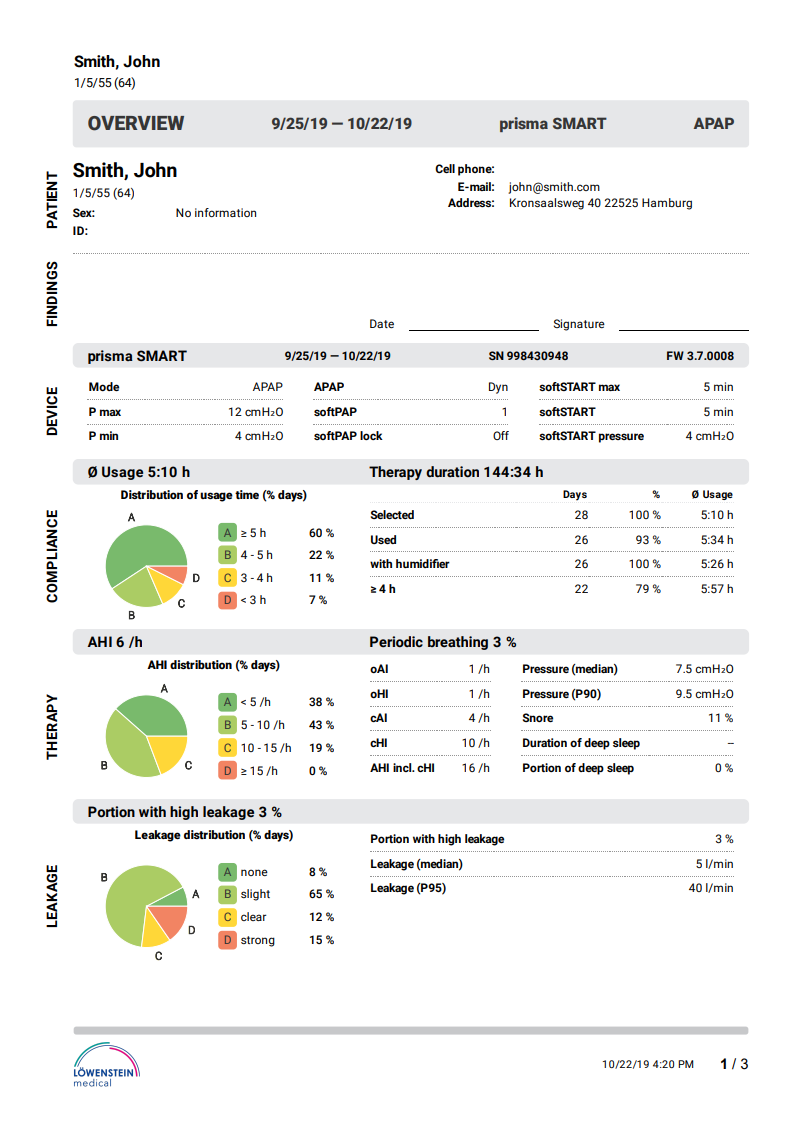
1. Overview page, which provides a summary about patients therapy situation over the entire time range selected for analysis
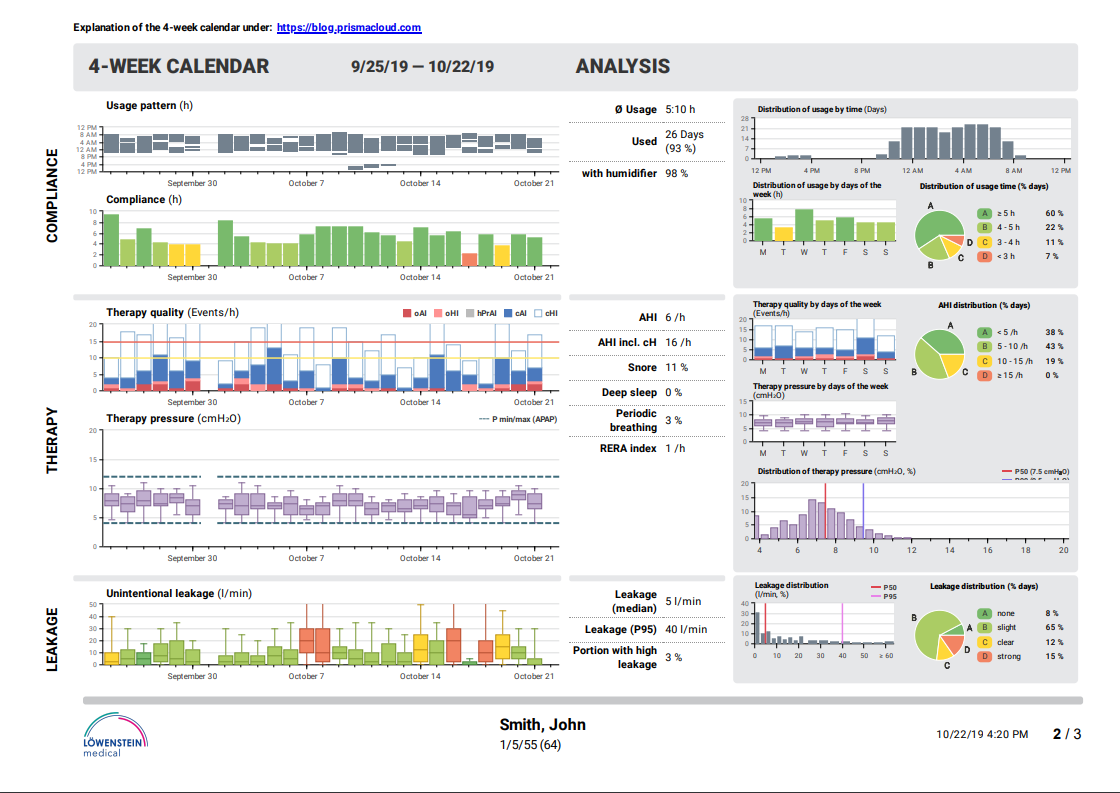
2. 4-week calendar, which provides a close-up analysis of last up to 28 days of selected time range for analysis. It supports you in identifying demand and type of intervention
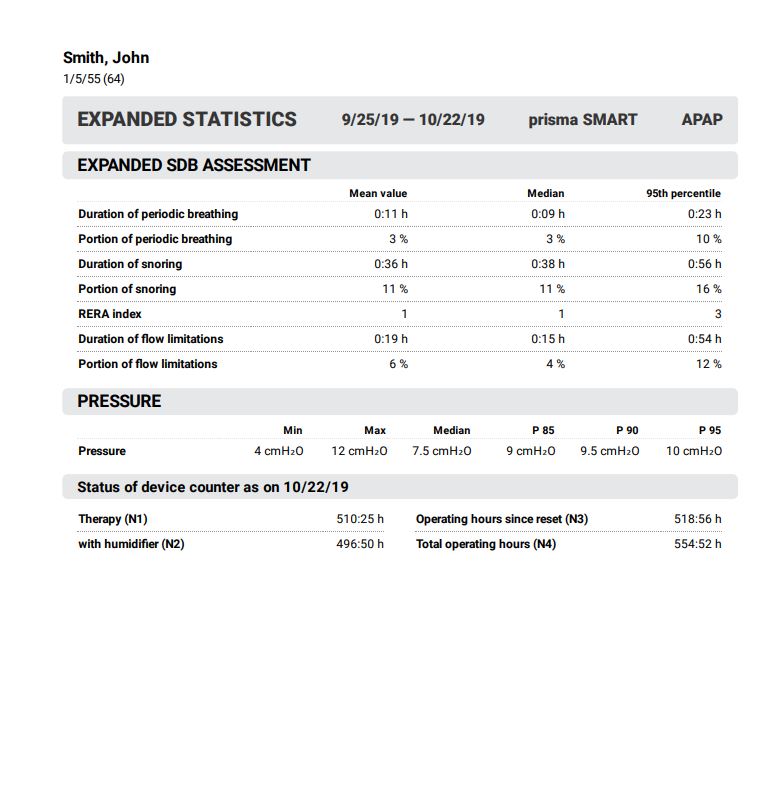
3. Expanded statistics, which provides more details about patients therapy situation over the entire time range selected for analysis.

Overview page
Beside administrative data of your patient, you will find the respective last therapy settings for the selected period, the overview of the device usage, major indices about the therapy success like o/c AHI, snoring, periodical breathing etc. as well as the information about the mask-fit.

4-week calendar
The 4-week calendar provides a close-up analysis of last up to 28 days of selected period for analysis. It supports you in identifying demand and type of intervention.
On the left part of the page, there is a therapy calendar with day-by-day data on device usage, therapy quality and leakage for the last 28 days. For the visualisation of some values like therapy pressure, leakage, breathing frequency or target volume, we use box plot diagrams.
From the right part of the 4-week calendar, so called Analysis part, you can get deeper insights about patient’s therapy.
The 4-week calendar is divided horizontally into 3 sections: Compliance, Therapy and Leakage

Expanded statistics

 829   2019   pdf   report   structure