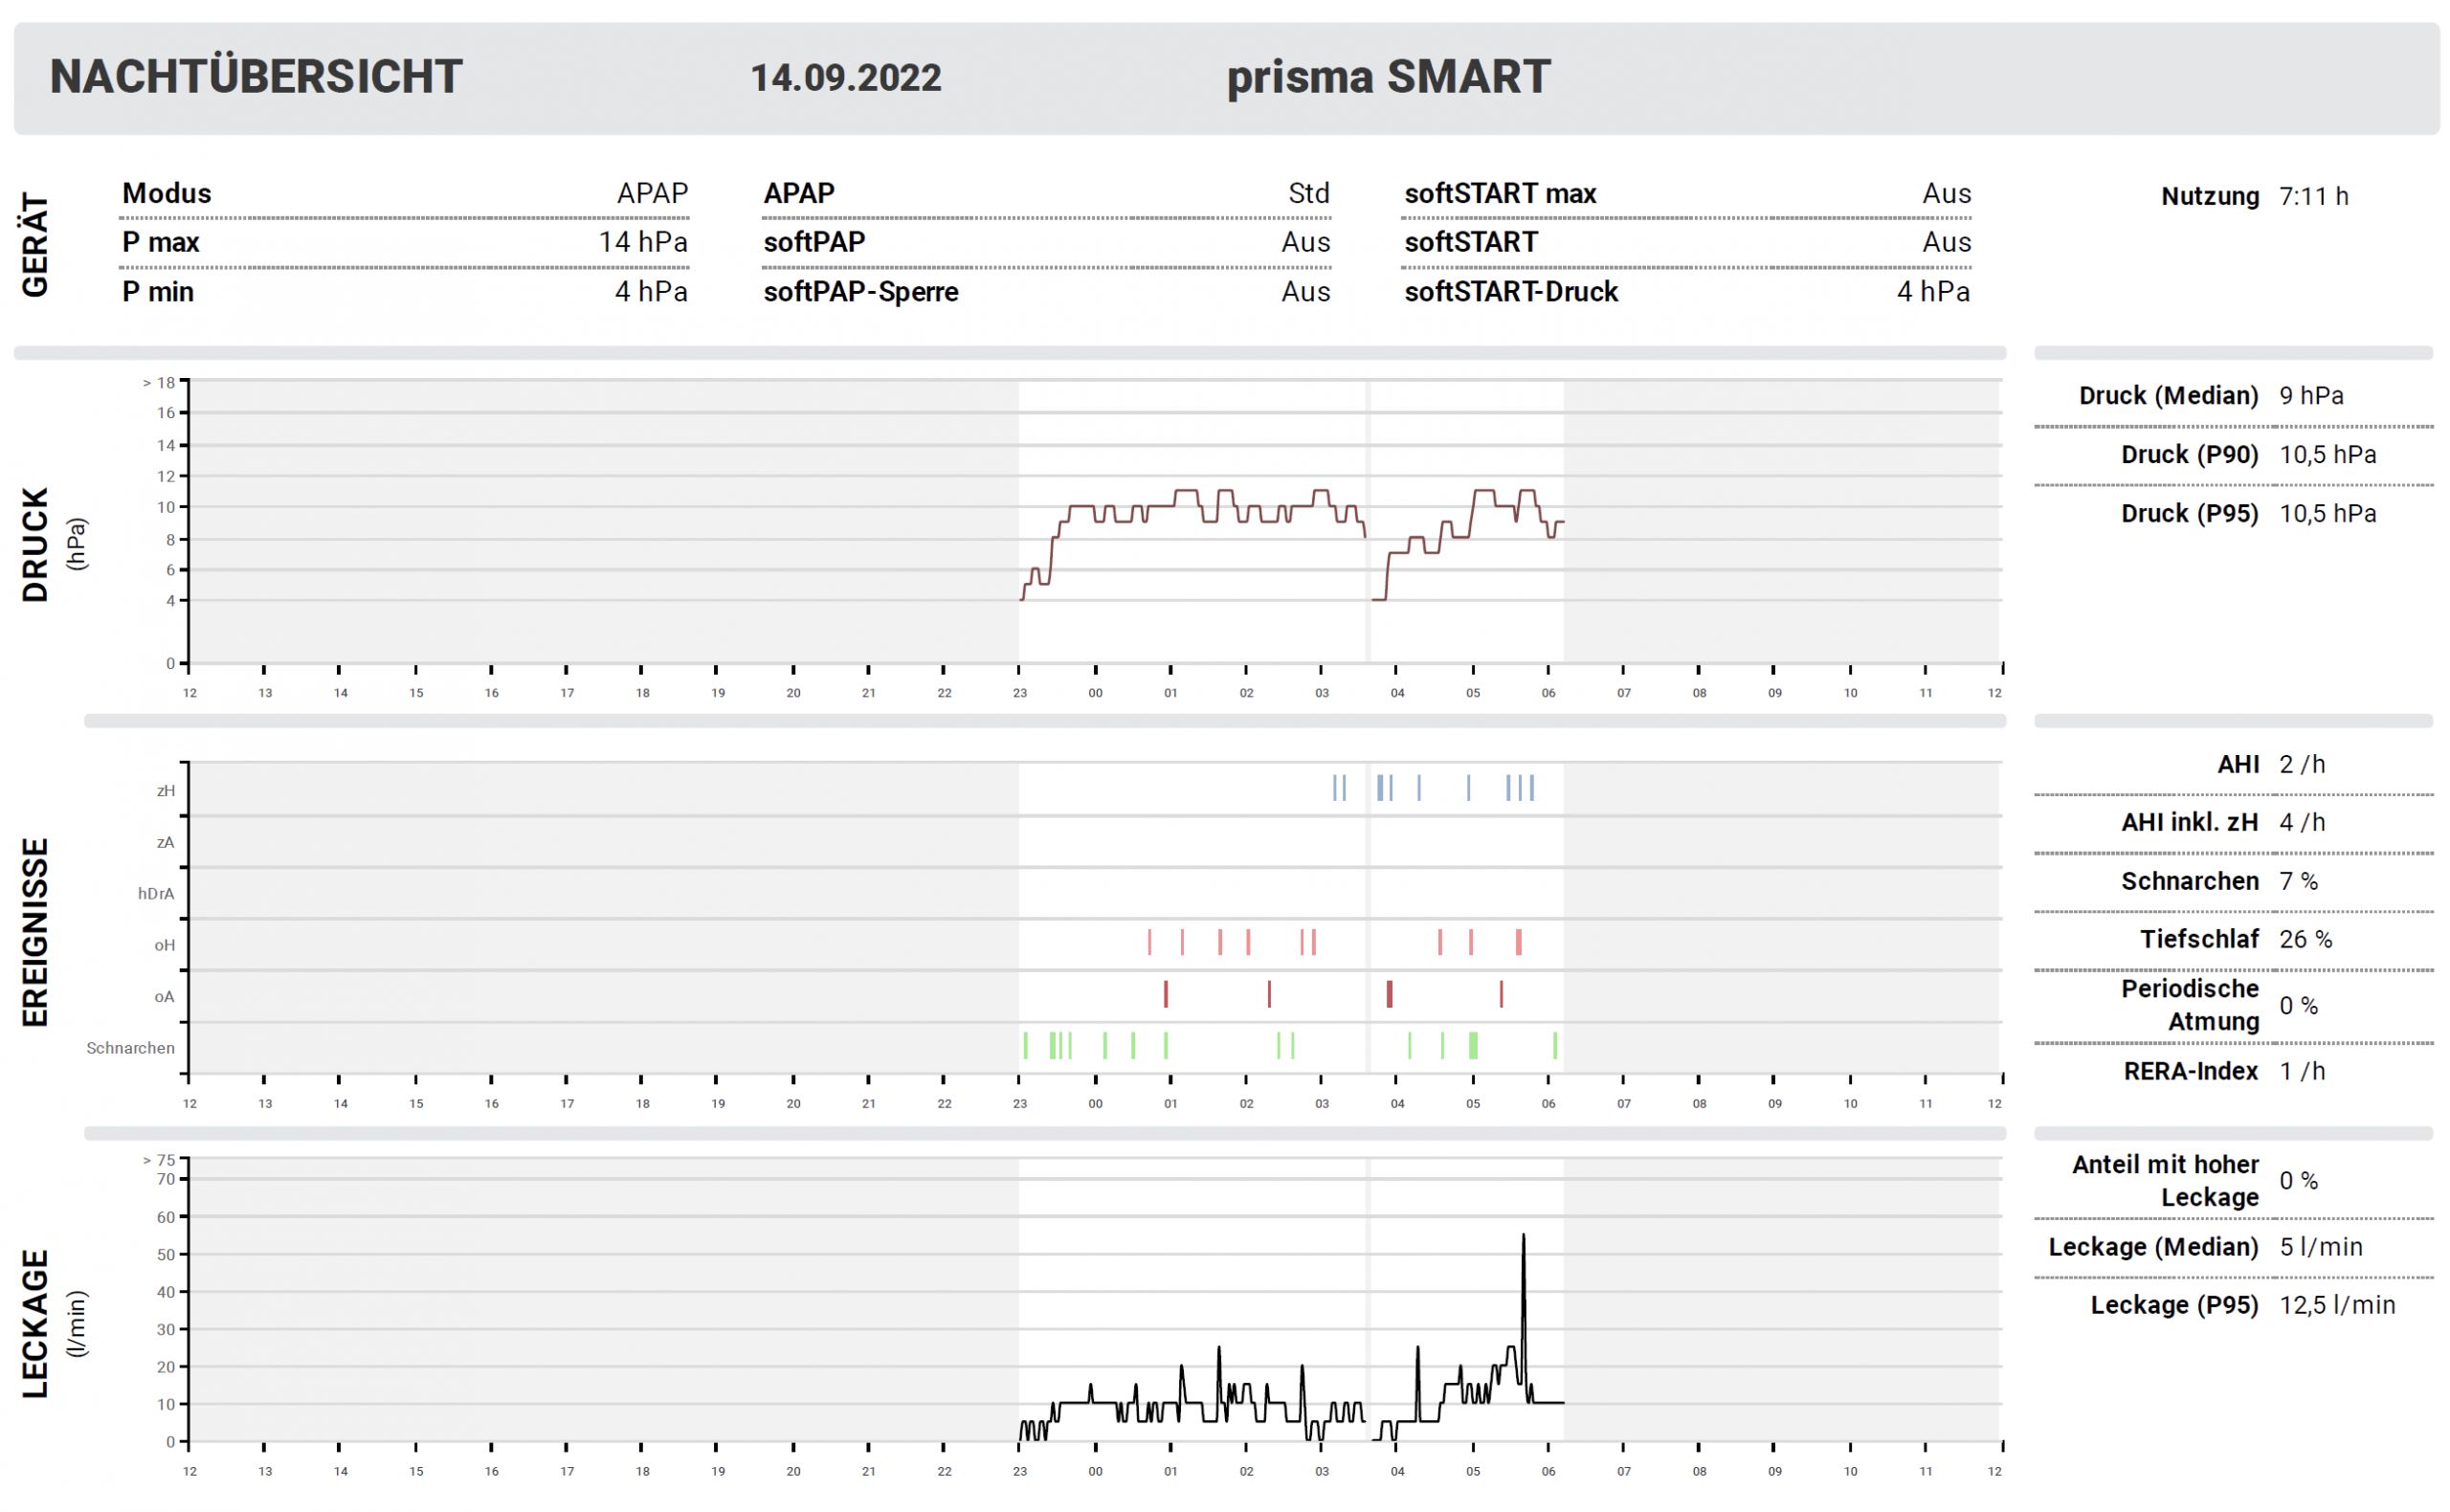
PDF Report – Night overview
Night Overview section provides visualization of trends for pressure, leakage and therapy events, based on low-resolution curves data received from therapy devices. In case this data is available within last 28 days of selected report period, each therapy day is printed on its own page (maximum 7 therapy days).
Low-resolution curves data (also called “trend curves”) is recorded 1 sample per 2 minutes in accordance with the following specification.
| Signal Name | Downsampling Specification | prisma SOFT/SMART | prisma VENT |
| Program Usage | Program with highest portion of usage in storage epoch | x | |
| Therapy pressure (CPAP / APAP / EPAP / zero if therapy mode is HFT) | Maximum value of storage epoch | x | x |
| Leakage | Maximum value of storage epoch | x | x |
| Respiratory rate | Median value of storage epoch | x | |
| Tidal Volume | Median value of storage epoch | x | |
| Minute Volume | Maximum value of storage epoch | x | |
| Ti/T | Median value of storage epoch | x | |
| SpO2 | Minimum value of storage epoch | x | |
| Pulse Rate | Maximum value of storage epoch | x | |
| Spontaneous Inspirations/Expirations | Portion of spontaneous inspirations in storage epoch | x | |
| oA | at least one event during storage epoch | x | x |
| cA | at least one event during storage epoch | x | |
| hPrA | at least one event during storage epoch | x | x |
| oH | at least one event during storage epoch | x | x |
| cH | at least one event during storage epoch | x | x |
| RERA | at least one event during storage epoch | x | |
| Snoring | at least one event during storage epoch | x |

Important to know
- prisma SOFT/SMART therapy devices transmit trend curves data only in case both conditions are met: (1) an SD-card is inserted into a device during therapy and transmission, and (2) device sends data upon automatic daily transmissions.
- prisma VENT therapy devices transmit trend curves data only starting from 3.9.5 firmware version.
